# SmartPerf User Guide
## Introduction
SmartPerf Device is a reliable, easy-to-use performance and power consumption test tool. In this tool, you can monitor the performance and power consumption of your application and device with quantitative indicators, such as FPS, CPU, GPU, RAM, and Temp.
Targeted at devices with or without screens, SmartPerf Device provides two modes: Device-hap and Device-daemon.
Device-hap is applicable to devices with screens and provides a visualized, intuitive UI that simplifies your operations. You can start and pause a test with a floating window, view performance data in real time, and save the test results for further analysis.
Device-daemon is applicable to devices with and without screens and works with shell commands.
### The following are the available indicators:
- CPU: The tool reads the frequencies and usage of CPU cores on the test device on a per second basis to measure the CPU usage of the target application. Sustained high CPU may lead to overheating.
- GPU: The tool reads the GPU frequency and load information of the test device on a per second basis to measure the GPU usage of the target application. High GPU usage can lead to performance drops and application slowdowns.
- FPS: The tool reads the frame rate, in frames per second (FPS), of the target application to measure the smoothness of the application image. A higher FPS generally means smoother visuals.
- POWER: The tool reads the current and voltage of the test device on a per second basis.
- TEMP: The tool reads the temperature information of the test device on a per second basis, including the battery temperature and system chip temperature.
- RAM: The tool reads the RAM usage of the target application on a per second basis.
- snapshot: The tool takes a screenshot of the application UI every 2 seconds.
## Principles
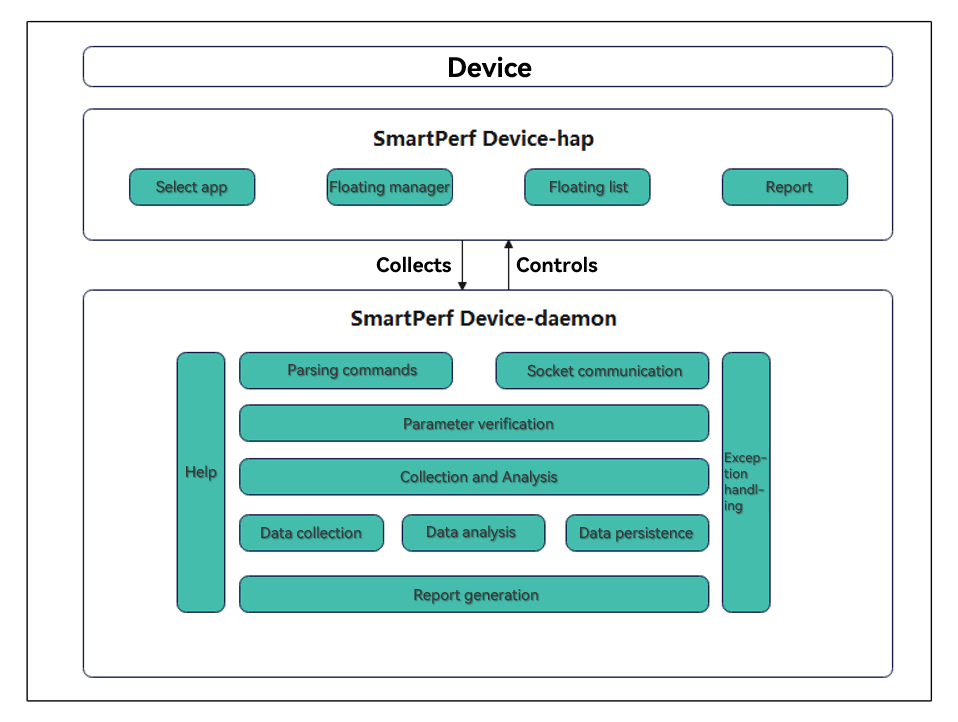
The figure below demonstrates the main functions of SmartPerf Device. Set data collection items and parameters on Device-hap, start the application, and then send data requests for KPIs (such as FPS, RAM, and Trace) from Device-hap to Device-daemon through messages. Device-daemon collects, persists, and analyzes data as requested, and then sends the data to Device-hap for display.
## Constraints
1. Device-daemon and Device-hap are pre-installed since API version 9.
2. Device-daemon must be connected to a hardware device, and Device-hap can only be used on devices with a screen.
3. Before using the Device-Daemon, configure the [HDC environment](https://gitee.com/openharmony/developtools_hdc).
## Performing Performance Testing
## SmartPerf Device-hap
The RK3568 development board is used as an example below.
### Obtaining the Application List
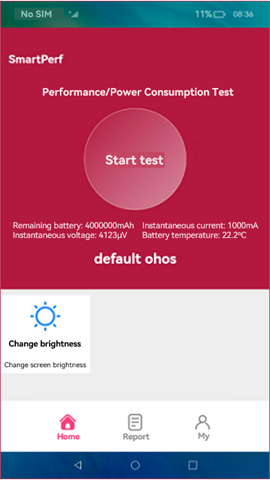
Start SmartPerf Device-hap. On the home screen, click **Select an app**.
 ### Setting Collection Parameters
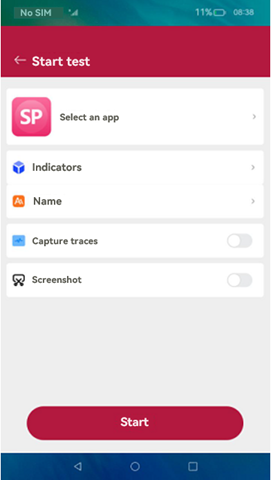
After the target application is selected, return to the start page and set the test indicators. You can also change the test name (which includes the name of the target application and the test time and will be displayed in the report), and specify whether to capture traces and whether to enable the screenshot feature. When you are done, click the **Start** button at the bottom.
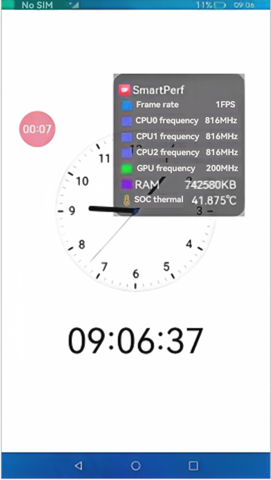
### Using the Floating Window to Manage Data Collection.
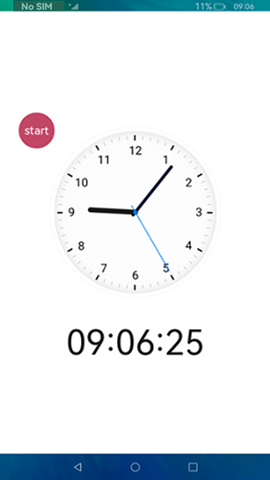
To start collection, touch **Start** in the floating window. To pause, touch the timer in the floating window. To resume, touch the timer again. To view the collected data in real time, double-touch the timer. To stop, touch and hold the timer.
### Setting Collection Parameters
After the target application is selected, return to the start page and set the test indicators. You can also change the test name (which includes the name of the target application and the test time and will be displayed in the report), and specify whether to capture traces and whether to enable the screenshot feature. When you are done, click the **Start** button at the bottom.
### Using the Floating Window to Manage Data Collection.
To start collection, touch **Start** in the floating window. To pause, touch the timer in the floating window. To resume, touch the timer again. To view the collected data in real time, double-touch the timer. To stop, touch and hold the timer.
You can drag the floating window to anywhere you like.
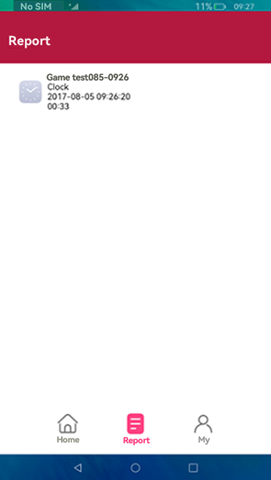
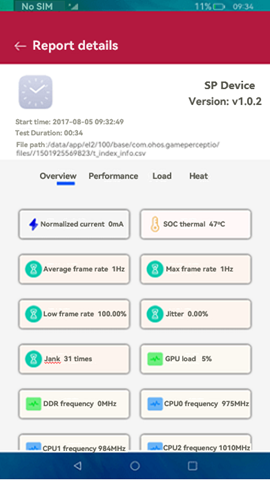
 ### Viewing the Report
Click **Report** to access the report list. Touch a report to view its details.
### Viewing the Report
Click **Report** to access the report list. Touch a report to view its details.
 ## SmartPerf Device-daemon
### Basic Collection Commands
| Command |Mandatory| Description |
| :-----| :-----| :--------------------- |
| -N |Yes| Sets the number of collection times (once per second). |
| -PKG |No| Sets the bundle name. |
| -c |No| Collects the CPU frequency and usage. If the application bundle name is set, the collected information covers both the system and the target application. If the application bundle name is not set, the collected information covers the system only. |
| -g |No| Collects the GPU frequency and load information. |
| -f |No| Collects the screen refresh rate and frame rate of the target application. The application bundle name must be specified. |
| -profilerfps |No| Collects the frame rate of the current page. |
| -t |No| Collects temperature information. |
| -p |No| Collects current and voltage information. |
| -r |No| Collects the RAM usage. If the application bundle name is set, the collected information covers both the system and the target application. If the application bundle name is not set, the collected information covers the system only. |
| -snapshot |No| Takes screenshots. |
| -net |No| Collects the network speed. |
| -VIEW |No| Sets the view layer. You must obtain the layer name first. |
| -screen |No| Collects the screen resolution and refresh rate. |
| -d |No| Collects the DDR data. |
| -sections|No| Sets segment-based collection. |
### Commands for Starting or Stopping Data Collection
| Command |Mandatory| Description |
| :-----|:-----| :--------------------- |
| -start |Yes| Starts collection. This command can be followed by basic collection commands. |
| -stop |Yes| Stops collection. A report is generated when collection is complete. |
### Example
You need to run the commands in the shell. You can check whether the daemon process is running, view the help information, run the collection command to collect data and view the collection result.
#### Switching to Shell
```
C:\Users\issusser>hdc shell
#
```
#### Starting and Viewing the Daemon Process
```
C:\Users\issusser>hdc shell
// Start the daemon process.
# SP_daemon
// Check whether the daemon process is running.
# ps -ef | grep SP_daemon
root 1584 1 0 21:50:05 ? 00:00:00 SP_daemon
root 1595 1574 3 21:51:02 pts/0 00:00:00 grep SP_daemon
#
```
#### Viewing the Help Information
```
# SP_daemon --help
OpenHarmony performance testing tool SmartPerf command-line version
Usage: SP_daemon
options:
-N set the collection times(default value is 0) range[1,2147483647], for example: -N 10
-PKG set package name, must add, for example: -PKG ohos.samples.ecg
-c get device CPU frequency and CPU usage, process CPU usage and CPU load ..
-g get device GPU frequency and GPU load
-f get app refresh fps(frames per second) and fps jitters and refreshrate
-profilerfps get refresh fps and timestamp
-sections set collection time period(using with profilerfps)
-t get remaining battery power and temperature..
-p get battery power consumption and voltage
-r get process memory and total memory
-snapshot get screen capture
-net get uplink and downlink traffic
-start collection start command
-stop collection stop command
-VIEW set layler, for example: -VIEW DisplayNode
-screen get screen resolution
-OUT set csv output path
-d get device DDR information
example:
SP_daemon -N 20 -c -g -t -p -r -net -snapshot -d
SP_daemon -N 20 -PKG ohos.samples.ecg -c -g -t -p -f -r -net -snapshot -d
SP_daemon -start -c
SP_daemon -stop
SP_daemon -screen
command exec finished!
#
```
#### Running the Collection Commands
- Collect twice the frequency and usage of CPU cores.
```
# SP_daemon -N 2 -c
order:0 timestamp=1501923846459
order:1 cpu0Frequency=408000
order:2 cpu0Usage=7.142857
order:3 cpu0idleUsage=92.857143
order:4 cpu0ioWaitUsage=0.000000
order:5 cpu0irqUsage=0.000000
order:6 cpu0niceUsage=0.000000
order:7 cpu0softIrqUsage=0.000000
order:8 cpu0systemUsage=5.102041
order:9 cpu0userUsage=2.040816
...
command exec finished!
#
```
- Collect twice the frequency and usage of CPU cores and CPU usage and load of processes.
```
# SP_daemon -N 2 -PKG ohos.samples.ecg -c
order:0 timestamp=1705043036099
order:1 ProcAppName=ohos.samples.ecg
order:2 ProcCpuLoad=0.008766
order:3 ProcCpuUsage=0.025100
order:4 ProcId=8815
order:5 ProcSCpuUsage=0.000000
order:6 ProcUCpuUsage=0.025100
order:7 cpu0Frequency=1430000
order:8 cpu0Usage=29.032258
order:9 cpu0idleUsage=70.967742
order:10 cpu0ioWaitUsage=0.000000
order:11 cpu0irqUsage=2.150538
order:12 cpu0niceUsage=0.000000
order:13 cpu0softIrqUsage=0.000000
order:14 cpu0systemUsage=15.053763
order:15 cpu0userUsage=11.827957
...
command exec finished!
#
```
>**NOTE**
>
>- Make sure you are on the application screen when running this command.
- Collect once the GPU frequency and load of the system.
```
# SP_daemon -N 1 -g
order:0 timestamp=1705041456507
order:1 gpuFrequency=279000000
order:2 gpuLoad=12.000000
command exec finished!
#
```
- Collect twice the system temperature.
```
# SP_daemon -N 2 -t
order:0 timestamp=1705042469378
order:1 Battery=36.000000
order:2 shell_back=38.962000
order:3 shell_frame=37.962000
order:4 shell_front=42.663000
order:5 soc_thermal=48.645000
order:6 system_h=38.277000
order:0 timestamp=1705042470389
order:1 Battery=36.000000
order:2 shell_back=38.962000
order:3 shell_frame=37.962000
order:4 shell_front=42.663000
order:5 soc_thermal=48.486000
order:6 system_h=38.277000
command exec finished!
#
```
- Collect once the current and voltage of the system.
```
# SP_daemon -N 1 -p
order:0 timestamp=1705041491090
order:1 currentNow=-255
order:2 voltageNow=4377614
command exec finished!
#
```
- Collect twice the memory information of the system.
```
# SP_daemon -N 2 -r
order:0 timestamp=1705041562521
order:1 memAvailable=7339224
order:2 memFree=7164708
order:3 memTotal=11641840
order:0 timestamp=1705041563527
order:1 memAvailable=7339136
order:2 memFree=7164684
order:3 memTotal=11641840
command exec finished!
#
```
- Collect the memory information of the system and a specified application once.
```
# SP_daemon -N 1 -PKG ohos.samples.ecg -r
order:0 timestamp=1720427095197
order:1 arktsHeapPss=17555
order:2 gpuPss=7021
order:3 graphicPss=163320
order:4 heapAlloc=120344
order:5 heapFree=14362
order:6 heapSize=133436
order:7 memAvailable=2757504
order:8 memFree=190852
order:9 memTotal=11742716
order:10 nativeHeapPss=49102
order:11 privateClean=1100020
order:12 privateDirty=175169
order:13 pss=422172
order:14 sharedClean=89348
order:15 sharedDirty=19084
order:16 stackPss=1588
order:17 swap=122076
order:18 swapPss=122076
command exec finished!
#
```
>**NOTE**
>
>- Make sure you are on the application screen when running this command.
>- This command integrates the **-m** command of historical version, which collects data such as arktsHeapPss, gpuPss, graphicPss.
- Take two screenshots.
```
# SP_daemon -N 2 -snapshot
order:0 timestamp=1705041753321
order:1 capture=data/local/tmp/capture/screenCap_1705041753321.png
/data/local/tmp/capture created!
order:0 timestamp=1705041754324
order:1 capture=NA
command exec finished!
#
```
>**NOTE**
>
>- Screenshots are collected every 2 seconds.
>
>-
>
>- When the collection is complete, you can view the screenshots in **data/local/tmp/capture**.
>
>- To export the screenshots to drive D, open a new CLI and run the **hdc file recv data/local/tmp/capture/screenCap_1700725192774.png D:\** command.
- Collect the network speeds twice.
```
# SP_daemon -N 2 -net
order:0 timestamp=1705041904832
order:1 networkDown=0
order:2 networkUp=0
order:0 timestamp=1705041905870
order:1 networkDown=22931
order:2 networkUp=2004
command exec finished!
#
```
- Collect the frame rate of the target application five times.
```
# SP_daemon -N 5 -PKG ohos.samples.ecg -f
order:0 timestamp=1705306472232
order:1 fps=43
order:2 fpsJitters=602261688;;8352083;;8267708;;8305209;;8298437;;8308854;;8313542;;8569271;;8061458;;8300521;;8308333;;8309896;;8429167;;8241667;;8258333;;8318229;;8312500;;8304167;;41760937;;16418750;;8298959;;8319270;;8308334;;8313541;;8302605;;8320312;;8298958;;8326042;;8321354;;8301042;;8310417;;8309895;;8308855;;8331250;;8286458;;8343229;;8278125;;8311458;;8306250;;8312500;;8320834;;8346875;;8283333
order:3 refreshrate=120
order:0 timestamp=1705306473234
order:1 fps=40
order:2 fpsJitters=674427313;;8191145;;8310417;;8319271;;8301562;;8318750;;8302084;;8314062;;8333334;;8283854;;8307812;;8311979;;8310417;;8307813;;8309375;;8323958;;8306250;;8308333;;8317709;;8296875;;8721875;;7895833;;8320833;;8340625;;8276563;;8409896;;8216145;;8310938;;8301042;;8362500;;8252604;;8317708;;8376042;;8256250;;8292187;;8303125;;8313542;;8310417;;8520312
order:3 refreshrate=120
...
command exec finished!
#
```
>**NOTE**
>
>- When running this command, make sure you are on the application screen, and then swipe on the screen or switch between screens.
>- When dynamic refresh rate (DRR) is enabled, the refresh rate changes in real time (multiple changes may occur within one second). The value of **refreshrate** is collected at a timestamp.
>
- Collect the frame rate of the specified view layer for 10 times.
```
# SP_daemon -N 10 -VIEW DisplayNode -f
order:0 timestamp=1705306822850
order:1 fps=15
order:2 fpsJitters=876291843;;8314062;;8308334;;8314583;;8310417;;8308333;;8326042;;8314583;;8292708;;8492709;;8143750;;8340104;;8294271;;8302604;;8297396
order:3 refreshrate=120
order:0 timestamp=1705306823852
order:1 fps=12
order:2 fpsJitters=906667363;;8279167;;8311458;;8315625;;8291146;;8313021;;8323438;;8293750;;8303125;;8313541;;8301563;;8317708
order:3 refreshrate=120
...
command exec finished!
#
```
>**NOTE**
>
>- **DisplayNode** indicates the name of the specified layer.
>
>- When using this command to collect data, you need to operate the page on the specified layer.
>
>- This command cannot be used to collect data with the frame rate of the specified application (**SP_daemon -N 20 -PKG ohos.samples.ecg -f** or **SP_daemon -N 20 -VIEW DisplayNode -f**).
- Collect DDR information once.
```
# SP_daemon -N 1 -d
order:0 timestamp=1710916175201
order:1 ddrFrequency=1531000000
command exec finished!
#
```
- Collect the full information of the system, including the CPU, GPU, temperature, current, voltage, memory, DDR, network speed, and screenshot information.
```
# SP_daemon -N 10 ohos.samples.ecg -c -g -t -p -f -r -d -net -snapshot
order:0 timestamp=1705042018276
order:1 cpu0Frequency=490000
order:2 cpu0Usage=33.000000
order:3 cpu0idleUsage=67.000000
order:4 cpu0ioWaitUsage=0.000000
order:5 cpu0irqUsage=1.000000
order:6 cpu0niceUsage=0.000000
order:7 cpu0softIrqUsage=0.000000
order:8 cpu0systemUsage=14.000000
order:9 cpu0userUsage=18.000000
...
order:115 gpuFrequency=279000000
order:116 gpuload=61.000000
order:117 Battery=28.000000
order:118 shell_back=31.529000
order:119 shell_frame=30.529000
order:120 shell_front=30.548000
order:121 soc_thermal=49.624000
order:122 system_h=30.150000
order:123 currentNow=278
order:124 voltageNow=4250532
order:125 memAvailable=6354252
order:126 memFree=5971776
order:127 memTotal=11530092
order:128 ddrFrequency=1531000000
order:129 networkDown=0
order:130 networkUp=0
order:131 capture=data/local/tmp/capture/screenCap_1711190737580.png
...
command exec finished!
#
```
- Collect the full information of the specified application, including the CPU, GPU, temperature, current, voltage, frame rate, memory, DDR, network speed, and screenshot information.
```
# SP_daemon -N 10 -PKG ohos.samples.ecg -c -g -t -p -f -r -d -net -snapshot
order:0 timestamp=1705042018276
order:1 ProcAppName=ohos.samples.ecg
order:2 ProcCpuLoad=0.000001
order:3 ProcCpuUsage=0.000000
order:4 ProcId=13131
order:5 ProcSCpuUsage=0.000000
order:6 ProcUCpuUsage=0.000000
order:7 cpu0Frequency=418000
order:8 cpu0Usage=27.884616
order:9 cpu0idleUsage=72.115385
order:10 cpu0ioWaitUsage=0.000000
order:11 cpu0irqUsage=0.961538
order:12 cpu0niceUsage=0.000000
order:13 cpu0softIrqUsage=0.000000
order:14 cpu0systemUsage=12.500000
order:15 cpu0userUsage=14.423077
...
order:115 gpuFrequency=279000000
order:116 gpuload=61.000000
order:117 Battery=28.000000
order:118 shell_back=31.529000
order:119 shell_frame=30.529000
order:120 shell_front=30.548000
order:121 soc_thermal=49.624000
order:122 system_h=30.150000
order:123 currentNow=278
order:124 voltageNow=4250532
order:125 fps=3
order:126 fpsJitters=881659966;;108846354;;8289583
order:127 refreshrate=120
order:128 arktsHeapPss=16464
order:129 gpuPss=7021
order:130 graphicPss=163320
order:131 heapAlloc=118870
order:132 heapFree=14076
order:133 heapSize=131948
order:134 memAcailable=2776508
order:135 memFree=258668
order:136 memTotal=11742716
order:137 nativeHeapPss=45361
order:138 privateClean=104828
order:139 privateDirty=175189
order:140 pss=419476
order:141 sharedClean=87744
order:142 sharedDirty=19084
order:143 stackPss=1592
order:144 swap=125408
order:145 swapPss=125408
order:146 ddrFrequency=749000000
order:147 networkDown=7893
order:148 networkUp=1546
order:149 capture=data/local/tmp/capture/screenCap_1711190737580.png
...
command exec finished!
#
```
>**NOTE**
>
>- Make sure you are on the application screen when running this command.
>
- Collect the frame rate of the current page.
```
# SP_daemon -profilerfps 10
set num:10 success
fps:0|1711692357278
fps:0|1711692358278
fps:1|1711692359278
fps:0|1711692360278
fps:0|1711692361278
fps:0|1711692362278
fps:0|1711692363278
fps:0|1711692364278
fps:26|1711692365278
fps:53|1711692366278
SP_daemon exec finished!
#
```
>**NOTE**
>
>- This command must be executed separately, and its collection result is not written into the **data.csv** file.
>
- Collect the frame rate by time segment.
```
# SP_daemon -profilerfps 100 -sectrions 10
set num:100 success
fps:0|1711692393278
fps:0|1711692394278
fps:0|1711692395278
fps:44|1711692396278
sectionsFps:0|1711692396278
sectionsFps:0|1711692396378
sectionsFps:40|1711692396478
sectionsFps:60|1711692396578
sectionsFps:60|1711692396678
sectionsFps:60|1711692396778
sectionsFps:60|1711692396878
sectionsFps:40|1711692396978
sectionsFps:60|1711692397078
sectionsFps:60|1711692397178
fps:51|1711692397278
...
SP_daemon exec finished!
#
```
>**NOTE**
>
>- In the preceding information, 100 indicates the number of collection times, which can be set to a positive integer. 10 indicates a segment. Currently, the value ranges from 1 to 10 (positive integer).
>
>- This command must be executed separately, and its collection result is not written into the **data.csv** file.
- Start and stop the service.
```
Start data collection.
# SP_daemon -start -c
SP_daemon Collection begins
command exec finished!
#
Stop data collection.
# SP_daemon -stop
SP_daemon Collection ended
Output Path: data/local/tmp/smartperf/1/t_index_info_csv
command exec finished!
#
```
>**NOTE**
>
>- To start data collection of the system, run the **SP_daemon -start -c -g -t -p -r -d -net -snapshot** command.
>
>- To start data collection of the system and process, run the **SP_daemon -start -PKG ohos.samples.ecg -c -g -t -p -f -r -d -net -snapshot** command.
>
>- Run the start command to start collection, operate the device or application, and then run the stop command to stop collection.
>
>- The results for the start and stop command are saved to the **data/local/tmp/smartperf/1/t_index_info.csv** file. You can also run the **hdc file recv** command to export the report. For example, run the **hdc file recv data/local/tmp/smartperf/1/t_index_info.csv D:\** command to export the report to drive D.
>
- Obtain the screen resolution.
```
# SP_daemon -screen
activeMode: 1260x2720, refreshrate=120
command exec finished!
#
```
>**NOTE**
>
>- **activeMode** indicates the current screen resolution, and **refreshrate** indicates the screen refresh rate.
>
>- This command must be executed separately, and its collection result is not written into the **data.csv** file.
#### Exporting and Viewing Collection Results
Before exporting and viewing the collection result, you need to run the preceding collection commands.
- By default, the collection results are saved to **/data/local/tmp/data.csv**.
- To check the path to the test result file:
```
C:\Users\issusser>hdc shell
# cd data/local/tmp
# ls
data.csv
#
```
- To export the test result file:
```
C:\Users\issusser>hdc file recv data/local/tmp/data.csv D:\
[I][2023-11-08 16:16:41] HdcFile::TransferSummary success
FileTransfer finish, Size:429, File count = 1, time:6ms rate:71.50kB/s
C:\Users\issusser>
```
- Open the **data.csv** file to view data.
The table below describes the data fields in the **data.csv** file.
| Data Field | Description |Remarks|
| :-----| :--------------------- |:-----|
| cpuFrequency | CPU core frequency. |Unit: Hz|
| cpuUasge | CPU core usage. |%|
| cpuidleUsage | CPU usage in idle state. |%|
| cpuioWaitUsage | CPU usage of I/O wait. |%|
| cpuirqUsage | CPU usage of hardware interrupts. |%|
| cpuniceUsage | CPU usage of user level processes with lower scheduling priority. |%|
| cpusoftIrqUsage | CPU usage of software interrupts. |%|
| cpusystemUsage | CPU usage in kernel mode. |%|
| cpuuserUsage | CPU usage in user mode. |%|
| ProcId | PID. |
| ProcAppName | App package name. ||
| ProcCpuLoad | Process CPU load. |%|
| ProcCpuUsage | CPU usage of the process. |%|
| ProcUCpuUsage | CPU usage of the process in user mode. |%|
| ProcSCpuUsage | CPU usage of the process in kernel mode. |%|
| gpuFrequ | GPU frequency of the system. |%|
| gpuLoad | GPU load of the system. |%|
| currentNow | Current value. |Unit: mA|
| voltageNow | Voltage value. |Unit: μV|
| fps | Number of frames per second. |Unit: FPS|
| fpsJitters | Frame interval. |Unit: ns|
| refreshrate | Screen refresh rate. |Unit: Hz|
| networkDown | Downstream rate. |Unit: byte/s|
| networkUp | Uplink rate. |Unit: byte/s|
| ddrFrequency | DDR frequency. |Unit: Hz|
| shell_front | Front cover temperature. |Unit: °C|
| shell_frame | Frame temperature. |Unit: °C|
| shell_back | Rear cover temperature. |Unit: °C|
| soc_thermal | SoC temperature. |Unit: °C|
| system_h | System temperature. |Unit: °C|
| Battery | Battery temperature. |Unit: °C|
| memAvailable | Available memory of the system. |Unit: KB|
| memFree | Free memory of the system. |Unit: KB|
| memTotal | Total memory of the system. |Unit: KB|
| pss | Proportional set size (PSS) of the process. |Unit: KB|
| sharedClean | Shared unwritten pages. |Unit: KB|
| sharedDirty | Shared rewritten pages. |Unit: KB|
| priviateClean | Private unwritten pages. |Unit: KB|
| privateDirty | Private rewritten pages. |Unit: KB|
| swapTotal | Total swap memory. |Unit: KB|
| swapPss | Swapped PSS. |Unit: KB|
| HeapSize | Heap size. |Unit: KB|
| HeapAlloc | Heap size that can be allocated. |Unit: KB|
| HeapFree | Remaining heap size. |Unit: KB|
| gpuPss | Used GPU size. |Unit: KB|
| graphicPss | Used graphics memory size. |Unit: KB|
| arktsHeapPss | Used ArkTS memory size. |Unit: KB|
| nativeHeapPss | Used native memory size. |Unit: KB|
| stackPss | Used stack memory size. |Unit: KB|
| timeStamp | Timestamp. |Collection time.|
## SmartPerf Device-daemon
### Basic Collection Commands
| Command |Mandatory| Description |
| :-----| :-----| :--------------------- |
| -N |Yes| Sets the number of collection times (once per second). |
| -PKG |No| Sets the bundle name. |
| -c |No| Collects the CPU frequency and usage. If the application bundle name is set, the collected information covers both the system and the target application. If the application bundle name is not set, the collected information covers the system only. |
| -g |No| Collects the GPU frequency and load information. |
| -f |No| Collects the screen refresh rate and frame rate of the target application. The application bundle name must be specified. |
| -profilerfps |No| Collects the frame rate of the current page. |
| -t |No| Collects temperature information. |
| -p |No| Collects current and voltage information. |
| -r |No| Collects the RAM usage. If the application bundle name is set, the collected information covers both the system and the target application. If the application bundle name is not set, the collected information covers the system only. |
| -snapshot |No| Takes screenshots. |
| -net |No| Collects the network speed. |
| -VIEW |No| Sets the view layer. You must obtain the layer name first. |
| -screen |No| Collects the screen resolution and refresh rate. |
| -d |No| Collects the DDR data. |
| -sections|No| Sets segment-based collection. |
### Commands for Starting or Stopping Data Collection
| Command |Mandatory| Description |
| :-----|:-----| :--------------------- |
| -start |Yes| Starts collection. This command can be followed by basic collection commands. |
| -stop |Yes| Stops collection. A report is generated when collection is complete. |
### Example
You need to run the commands in the shell. You can check whether the daemon process is running, view the help information, run the collection command to collect data and view the collection result.
#### Switching to Shell
```
C:\Users\issusser>hdc shell
#
```
#### Starting and Viewing the Daemon Process
```
C:\Users\issusser>hdc shell
// Start the daemon process.
# SP_daemon
// Check whether the daemon process is running.
# ps -ef | grep SP_daemon
root 1584 1 0 21:50:05 ? 00:00:00 SP_daemon
root 1595 1574 3 21:51:02 pts/0 00:00:00 grep SP_daemon
#
```
#### Viewing the Help Information
```
# SP_daemon --help
OpenHarmony performance testing tool SmartPerf command-line version
Usage: SP_daemon
options:
-N set the collection times(default value is 0) range[1,2147483647], for example: -N 10
-PKG set package name, must add, for example: -PKG ohos.samples.ecg
-c get device CPU frequency and CPU usage, process CPU usage and CPU load ..
-g get device GPU frequency and GPU load
-f get app refresh fps(frames per second) and fps jitters and refreshrate
-profilerfps get refresh fps and timestamp
-sections set collection time period(using with profilerfps)
-t get remaining battery power and temperature..
-p get battery power consumption and voltage
-r get process memory and total memory
-snapshot get screen capture
-net get uplink and downlink traffic
-start collection start command
-stop collection stop command
-VIEW set layler, for example: -VIEW DisplayNode
-screen get screen resolution
-OUT set csv output path
-d get device DDR information
example:
SP_daemon -N 20 -c -g -t -p -r -net -snapshot -d
SP_daemon -N 20 -PKG ohos.samples.ecg -c -g -t -p -f -r -net -snapshot -d
SP_daemon -start -c
SP_daemon -stop
SP_daemon -screen
command exec finished!
#
```
#### Running the Collection Commands
- Collect twice the frequency and usage of CPU cores.
```
# SP_daemon -N 2 -c
order:0 timestamp=1501923846459
order:1 cpu0Frequency=408000
order:2 cpu0Usage=7.142857
order:3 cpu0idleUsage=92.857143
order:4 cpu0ioWaitUsage=0.000000
order:5 cpu0irqUsage=0.000000
order:6 cpu0niceUsage=0.000000
order:7 cpu0softIrqUsage=0.000000
order:8 cpu0systemUsage=5.102041
order:9 cpu0userUsage=2.040816
...
command exec finished!
#
```
- Collect twice the frequency and usage of CPU cores and CPU usage and load of processes.
```
# SP_daemon -N 2 -PKG ohos.samples.ecg -c
order:0 timestamp=1705043036099
order:1 ProcAppName=ohos.samples.ecg
order:2 ProcCpuLoad=0.008766
order:3 ProcCpuUsage=0.025100
order:4 ProcId=8815
order:5 ProcSCpuUsage=0.000000
order:6 ProcUCpuUsage=0.025100
order:7 cpu0Frequency=1430000
order:8 cpu0Usage=29.032258
order:9 cpu0idleUsage=70.967742
order:10 cpu0ioWaitUsage=0.000000
order:11 cpu0irqUsage=2.150538
order:12 cpu0niceUsage=0.000000
order:13 cpu0softIrqUsage=0.000000
order:14 cpu0systemUsage=15.053763
order:15 cpu0userUsage=11.827957
...
command exec finished!
#
```
>**NOTE**
>
>- Make sure you are on the application screen when running this command.
- Collect once the GPU frequency and load of the system.
```
# SP_daemon -N 1 -g
order:0 timestamp=1705041456507
order:1 gpuFrequency=279000000
order:2 gpuLoad=12.000000
command exec finished!
#
```
- Collect twice the system temperature.
```
# SP_daemon -N 2 -t
order:0 timestamp=1705042469378
order:1 Battery=36.000000
order:2 shell_back=38.962000
order:3 shell_frame=37.962000
order:4 shell_front=42.663000
order:5 soc_thermal=48.645000
order:6 system_h=38.277000
order:0 timestamp=1705042470389
order:1 Battery=36.000000
order:2 shell_back=38.962000
order:3 shell_frame=37.962000
order:4 shell_front=42.663000
order:5 soc_thermal=48.486000
order:6 system_h=38.277000
command exec finished!
#
```
- Collect once the current and voltage of the system.
```
# SP_daemon -N 1 -p
order:0 timestamp=1705041491090
order:1 currentNow=-255
order:2 voltageNow=4377614
command exec finished!
#
```
- Collect twice the memory information of the system.
```
# SP_daemon -N 2 -r
order:0 timestamp=1705041562521
order:1 memAvailable=7339224
order:2 memFree=7164708
order:3 memTotal=11641840
order:0 timestamp=1705041563527
order:1 memAvailable=7339136
order:2 memFree=7164684
order:3 memTotal=11641840
command exec finished!
#
```
- Collect the memory information of the system and a specified application once.
```
# SP_daemon -N 1 -PKG ohos.samples.ecg -r
order:0 timestamp=1720427095197
order:1 arktsHeapPss=17555
order:2 gpuPss=7021
order:3 graphicPss=163320
order:4 heapAlloc=120344
order:5 heapFree=14362
order:6 heapSize=133436
order:7 memAvailable=2757504
order:8 memFree=190852
order:9 memTotal=11742716
order:10 nativeHeapPss=49102
order:11 privateClean=1100020
order:12 privateDirty=175169
order:13 pss=422172
order:14 sharedClean=89348
order:15 sharedDirty=19084
order:16 stackPss=1588
order:17 swap=122076
order:18 swapPss=122076
command exec finished!
#
```
>**NOTE**
>
>- Make sure you are on the application screen when running this command.
>- This command integrates the **-m** command of historical version, which collects data such as arktsHeapPss, gpuPss, graphicPss.
- Take two screenshots.
```
# SP_daemon -N 2 -snapshot
order:0 timestamp=1705041753321
order:1 capture=data/local/tmp/capture/screenCap_1705041753321.png
/data/local/tmp/capture created!
order:0 timestamp=1705041754324
order:1 capture=NA
command exec finished!
#
```
>**NOTE**
>
>- Screenshots are collected every 2 seconds.
>
>-
>
>- When the collection is complete, you can view the screenshots in **data/local/tmp/capture**.
>
>- To export the screenshots to drive D, open a new CLI and run the **hdc file recv data/local/tmp/capture/screenCap_1700725192774.png D:\** command.
- Collect the network speeds twice.
```
# SP_daemon -N 2 -net
order:0 timestamp=1705041904832
order:1 networkDown=0
order:2 networkUp=0
order:0 timestamp=1705041905870
order:1 networkDown=22931
order:2 networkUp=2004
command exec finished!
#
```
- Collect the frame rate of the target application five times.
```
# SP_daemon -N 5 -PKG ohos.samples.ecg -f
order:0 timestamp=1705306472232
order:1 fps=43
order:2 fpsJitters=602261688;;8352083;;8267708;;8305209;;8298437;;8308854;;8313542;;8569271;;8061458;;8300521;;8308333;;8309896;;8429167;;8241667;;8258333;;8318229;;8312500;;8304167;;41760937;;16418750;;8298959;;8319270;;8308334;;8313541;;8302605;;8320312;;8298958;;8326042;;8321354;;8301042;;8310417;;8309895;;8308855;;8331250;;8286458;;8343229;;8278125;;8311458;;8306250;;8312500;;8320834;;8346875;;8283333
order:3 refreshrate=120
order:0 timestamp=1705306473234
order:1 fps=40
order:2 fpsJitters=674427313;;8191145;;8310417;;8319271;;8301562;;8318750;;8302084;;8314062;;8333334;;8283854;;8307812;;8311979;;8310417;;8307813;;8309375;;8323958;;8306250;;8308333;;8317709;;8296875;;8721875;;7895833;;8320833;;8340625;;8276563;;8409896;;8216145;;8310938;;8301042;;8362500;;8252604;;8317708;;8376042;;8256250;;8292187;;8303125;;8313542;;8310417;;8520312
order:3 refreshrate=120
...
command exec finished!
#
```
>**NOTE**
>
>- When running this command, make sure you are on the application screen, and then swipe on the screen or switch between screens.
>- When dynamic refresh rate (DRR) is enabled, the refresh rate changes in real time (multiple changes may occur within one second). The value of **refreshrate** is collected at a timestamp.
>
- Collect the frame rate of the specified view layer for 10 times.
```
# SP_daemon -N 10 -VIEW DisplayNode -f
order:0 timestamp=1705306822850
order:1 fps=15
order:2 fpsJitters=876291843;;8314062;;8308334;;8314583;;8310417;;8308333;;8326042;;8314583;;8292708;;8492709;;8143750;;8340104;;8294271;;8302604;;8297396
order:3 refreshrate=120
order:0 timestamp=1705306823852
order:1 fps=12
order:2 fpsJitters=906667363;;8279167;;8311458;;8315625;;8291146;;8313021;;8323438;;8293750;;8303125;;8313541;;8301563;;8317708
order:3 refreshrate=120
...
command exec finished!
#
```
>**NOTE**
>
>- **DisplayNode** indicates the name of the specified layer.
>
>- When using this command to collect data, you need to operate the page on the specified layer.
>
>- This command cannot be used to collect data with the frame rate of the specified application (**SP_daemon -N 20 -PKG ohos.samples.ecg -f** or **SP_daemon -N 20 -VIEW DisplayNode -f**).
- Collect DDR information once.
```
# SP_daemon -N 1 -d
order:0 timestamp=1710916175201
order:1 ddrFrequency=1531000000
command exec finished!
#
```
- Collect the full information of the system, including the CPU, GPU, temperature, current, voltage, memory, DDR, network speed, and screenshot information.
```
# SP_daemon -N 10 ohos.samples.ecg -c -g -t -p -f -r -d -net -snapshot
order:0 timestamp=1705042018276
order:1 cpu0Frequency=490000
order:2 cpu0Usage=33.000000
order:3 cpu0idleUsage=67.000000
order:4 cpu0ioWaitUsage=0.000000
order:5 cpu0irqUsage=1.000000
order:6 cpu0niceUsage=0.000000
order:7 cpu0softIrqUsage=0.000000
order:8 cpu0systemUsage=14.000000
order:9 cpu0userUsage=18.000000
...
order:115 gpuFrequency=279000000
order:116 gpuload=61.000000
order:117 Battery=28.000000
order:118 shell_back=31.529000
order:119 shell_frame=30.529000
order:120 shell_front=30.548000
order:121 soc_thermal=49.624000
order:122 system_h=30.150000
order:123 currentNow=278
order:124 voltageNow=4250532
order:125 memAvailable=6354252
order:126 memFree=5971776
order:127 memTotal=11530092
order:128 ddrFrequency=1531000000
order:129 networkDown=0
order:130 networkUp=0
order:131 capture=data/local/tmp/capture/screenCap_1711190737580.png
...
command exec finished!
#
```
- Collect the full information of the specified application, including the CPU, GPU, temperature, current, voltage, frame rate, memory, DDR, network speed, and screenshot information.
```
# SP_daemon -N 10 -PKG ohos.samples.ecg -c -g -t -p -f -r -d -net -snapshot
order:0 timestamp=1705042018276
order:1 ProcAppName=ohos.samples.ecg
order:2 ProcCpuLoad=0.000001
order:3 ProcCpuUsage=0.000000
order:4 ProcId=13131
order:5 ProcSCpuUsage=0.000000
order:6 ProcUCpuUsage=0.000000
order:7 cpu0Frequency=418000
order:8 cpu0Usage=27.884616
order:9 cpu0idleUsage=72.115385
order:10 cpu0ioWaitUsage=0.000000
order:11 cpu0irqUsage=0.961538
order:12 cpu0niceUsage=0.000000
order:13 cpu0softIrqUsage=0.000000
order:14 cpu0systemUsage=12.500000
order:15 cpu0userUsage=14.423077
...
order:115 gpuFrequency=279000000
order:116 gpuload=61.000000
order:117 Battery=28.000000
order:118 shell_back=31.529000
order:119 shell_frame=30.529000
order:120 shell_front=30.548000
order:121 soc_thermal=49.624000
order:122 system_h=30.150000
order:123 currentNow=278
order:124 voltageNow=4250532
order:125 fps=3
order:126 fpsJitters=881659966;;108846354;;8289583
order:127 refreshrate=120
order:128 arktsHeapPss=16464
order:129 gpuPss=7021
order:130 graphicPss=163320
order:131 heapAlloc=118870
order:132 heapFree=14076
order:133 heapSize=131948
order:134 memAcailable=2776508
order:135 memFree=258668
order:136 memTotal=11742716
order:137 nativeHeapPss=45361
order:138 privateClean=104828
order:139 privateDirty=175189
order:140 pss=419476
order:141 sharedClean=87744
order:142 sharedDirty=19084
order:143 stackPss=1592
order:144 swap=125408
order:145 swapPss=125408
order:146 ddrFrequency=749000000
order:147 networkDown=7893
order:148 networkUp=1546
order:149 capture=data/local/tmp/capture/screenCap_1711190737580.png
...
command exec finished!
#
```
>**NOTE**
>
>- Make sure you are on the application screen when running this command.
>
- Collect the frame rate of the current page.
```
# SP_daemon -profilerfps 10
set num:10 success
fps:0|1711692357278
fps:0|1711692358278
fps:1|1711692359278
fps:0|1711692360278
fps:0|1711692361278
fps:0|1711692362278
fps:0|1711692363278
fps:0|1711692364278
fps:26|1711692365278
fps:53|1711692366278
SP_daemon exec finished!
#
```
>**NOTE**
>
>- This command must be executed separately, and its collection result is not written into the **data.csv** file.
>
- Collect the frame rate by time segment.
```
# SP_daemon -profilerfps 100 -sectrions 10
set num:100 success
fps:0|1711692393278
fps:0|1711692394278
fps:0|1711692395278
fps:44|1711692396278
sectionsFps:0|1711692396278
sectionsFps:0|1711692396378
sectionsFps:40|1711692396478
sectionsFps:60|1711692396578
sectionsFps:60|1711692396678
sectionsFps:60|1711692396778
sectionsFps:60|1711692396878
sectionsFps:40|1711692396978
sectionsFps:60|1711692397078
sectionsFps:60|1711692397178
fps:51|1711692397278
...
SP_daemon exec finished!
#
```
>**NOTE**
>
>- In the preceding information, 100 indicates the number of collection times, which can be set to a positive integer. 10 indicates a segment. Currently, the value ranges from 1 to 10 (positive integer).
>
>- This command must be executed separately, and its collection result is not written into the **data.csv** file.
- Start and stop the service.
```
Start data collection.
# SP_daemon -start -c
SP_daemon Collection begins
command exec finished!
#
Stop data collection.
# SP_daemon -stop
SP_daemon Collection ended
Output Path: data/local/tmp/smartperf/1/t_index_info_csv
command exec finished!
#
```
>**NOTE**
>
>- To start data collection of the system, run the **SP_daemon -start -c -g -t -p -r -d -net -snapshot** command.
>
>- To start data collection of the system and process, run the **SP_daemon -start -PKG ohos.samples.ecg -c -g -t -p -f -r -d -net -snapshot** command.
>
>- Run the start command to start collection, operate the device or application, and then run the stop command to stop collection.
>
>- The results for the start and stop command are saved to the **data/local/tmp/smartperf/1/t_index_info.csv** file. You can also run the **hdc file recv** command to export the report. For example, run the **hdc file recv data/local/tmp/smartperf/1/t_index_info.csv D:\** command to export the report to drive D.
>
- Obtain the screen resolution.
```
# SP_daemon -screen
activeMode: 1260x2720, refreshrate=120
command exec finished!
#
```
>**NOTE**
>
>- **activeMode** indicates the current screen resolution, and **refreshrate** indicates the screen refresh rate.
>
>- This command must be executed separately, and its collection result is not written into the **data.csv** file.
#### Exporting and Viewing Collection Results
Before exporting and viewing the collection result, you need to run the preceding collection commands.
- By default, the collection results are saved to **/data/local/tmp/data.csv**.
- To check the path to the test result file:
```
C:\Users\issusser>hdc shell
# cd data/local/tmp
# ls
data.csv
#
```
- To export the test result file:
```
C:\Users\issusser>hdc file recv data/local/tmp/data.csv D:\
[I][2023-11-08 16:16:41] HdcFile::TransferSummary success
FileTransfer finish, Size:429, File count = 1, time:6ms rate:71.50kB/s
C:\Users\issusser>
```
- Open the **data.csv** file to view data.
The table below describes the data fields in the **data.csv** file.
| Data Field | Description |Remarks|
| :-----| :--------------------- |:-----|
| cpuFrequency | CPU core frequency. |Unit: Hz|
| cpuUasge | CPU core usage. |%|
| cpuidleUsage | CPU usage in idle state. |%|
| cpuioWaitUsage | CPU usage of I/O wait. |%|
| cpuirqUsage | CPU usage of hardware interrupts. |%|
| cpuniceUsage | CPU usage of user level processes with lower scheduling priority. |%|
| cpusoftIrqUsage | CPU usage of software interrupts. |%|
| cpusystemUsage | CPU usage in kernel mode. |%|
| cpuuserUsage | CPU usage in user mode. |%|
| ProcId | PID. |
| ProcAppName | App package name. ||
| ProcCpuLoad | Process CPU load. |%|
| ProcCpuUsage | CPU usage of the process. |%|
| ProcUCpuUsage | CPU usage of the process in user mode. |%|
| ProcSCpuUsage | CPU usage of the process in kernel mode. |%|
| gpuFrequ | GPU frequency of the system. |%|
| gpuLoad | GPU load of the system. |%|
| currentNow | Current value. |Unit: mA|
| voltageNow | Voltage value. |Unit: μV|
| fps | Number of frames per second. |Unit: FPS|
| fpsJitters | Frame interval. |Unit: ns|
| refreshrate | Screen refresh rate. |Unit: Hz|
| networkDown | Downstream rate. |Unit: byte/s|
| networkUp | Uplink rate. |Unit: byte/s|
| ddrFrequency | DDR frequency. |Unit: Hz|
| shell_front | Front cover temperature. |Unit: °C|
| shell_frame | Frame temperature. |Unit: °C|
| shell_back | Rear cover temperature. |Unit: °C|
| soc_thermal | SoC temperature. |Unit: °C|
| system_h | System temperature. |Unit: °C|
| Battery | Battery temperature. |Unit: °C|
| memAvailable | Available memory of the system. |Unit: KB|
| memFree | Free memory of the system. |Unit: KB|
| memTotal | Total memory of the system. |Unit: KB|
| pss | Proportional set size (PSS) of the process. |Unit: KB|
| sharedClean | Shared unwritten pages. |Unit: KB|
| sharedDirty | Shared rewritten pages. |Unit: KB|
| priviateClean | Private unwritten pages. |Unit: KB|
| privateDirty | Private rewritten pages. |Unit: KB|
| swapTotal | Total swap memory. |Unit: KB|
| swapPss | Swapped PSS. |Unit: KB|
| HeapSize | Heap size. |Unit: KB|
| HeapAlloc | Heap size that can be allocated. |Unit: KB|
| HeapFree | Remaining heap size. |Unit: KB|
| gpuPss | Used GPU size. |Unit: KB|
| graphicPss | Used graphics memory size. |Unit: KB|
| arktsHeapPss | Used ArkTS memory size. |Unit: KB|
| nativeHeapPss | Used native memory size. |Unit: KB|
| stackPss | Used stack memory size. |Unit: KB|
| timeStamp | Timestamp. |Collection time.|